August 2021
At work we use FlowType on our JavaScript application. I’m a fan of JS type checkers, flow is not my favorite, but what is important is that it works.
However, when I joined the company I was surprised on how slow Flow was in our project. The project is large but not extremely large. Facebook codebase is orders of magnitude bigger, yet this is the performance I see sometimes
Upon saving this file, flow triggers a ~420 file dependency check and takes ~10 seconds to actually report any type errors.
First I started checking nothing was poorly set up in our project. A lot of the debugging help came from Stack Overflow and other people with flow experience.
Some of the things I tried:
Flow is a large project and facebook depends on it, so the chances that it is doing something wrong are slim, but I couldn’t believe making a change on certain file, did indeed trigger a 400+ file check. I needed to make sure.
I scoured the web trying to find out how debug the type dependency tree, but found nothing. The biggest pain point for me about flow, is the utter lack of documentation and community, the flow team also pays very little attention to the outside world and their priority is to support the facebook codebase.
After many hours ended up figuring out the right command to output the entire dependency graph for the app:
yarn flow graph dep-graph --strip-root --out ./output
This however it only produces the entire app graph… you can imagine this file is hundred thousand of lines of dependencies. In any case, this outputs a DOT file (from graphviz), which in theory you can easily visualize by using the right command:
# install dot via "brew install graphviz"

# I tried a png first... it just fails

dot -Tsvg output -o graph.svg
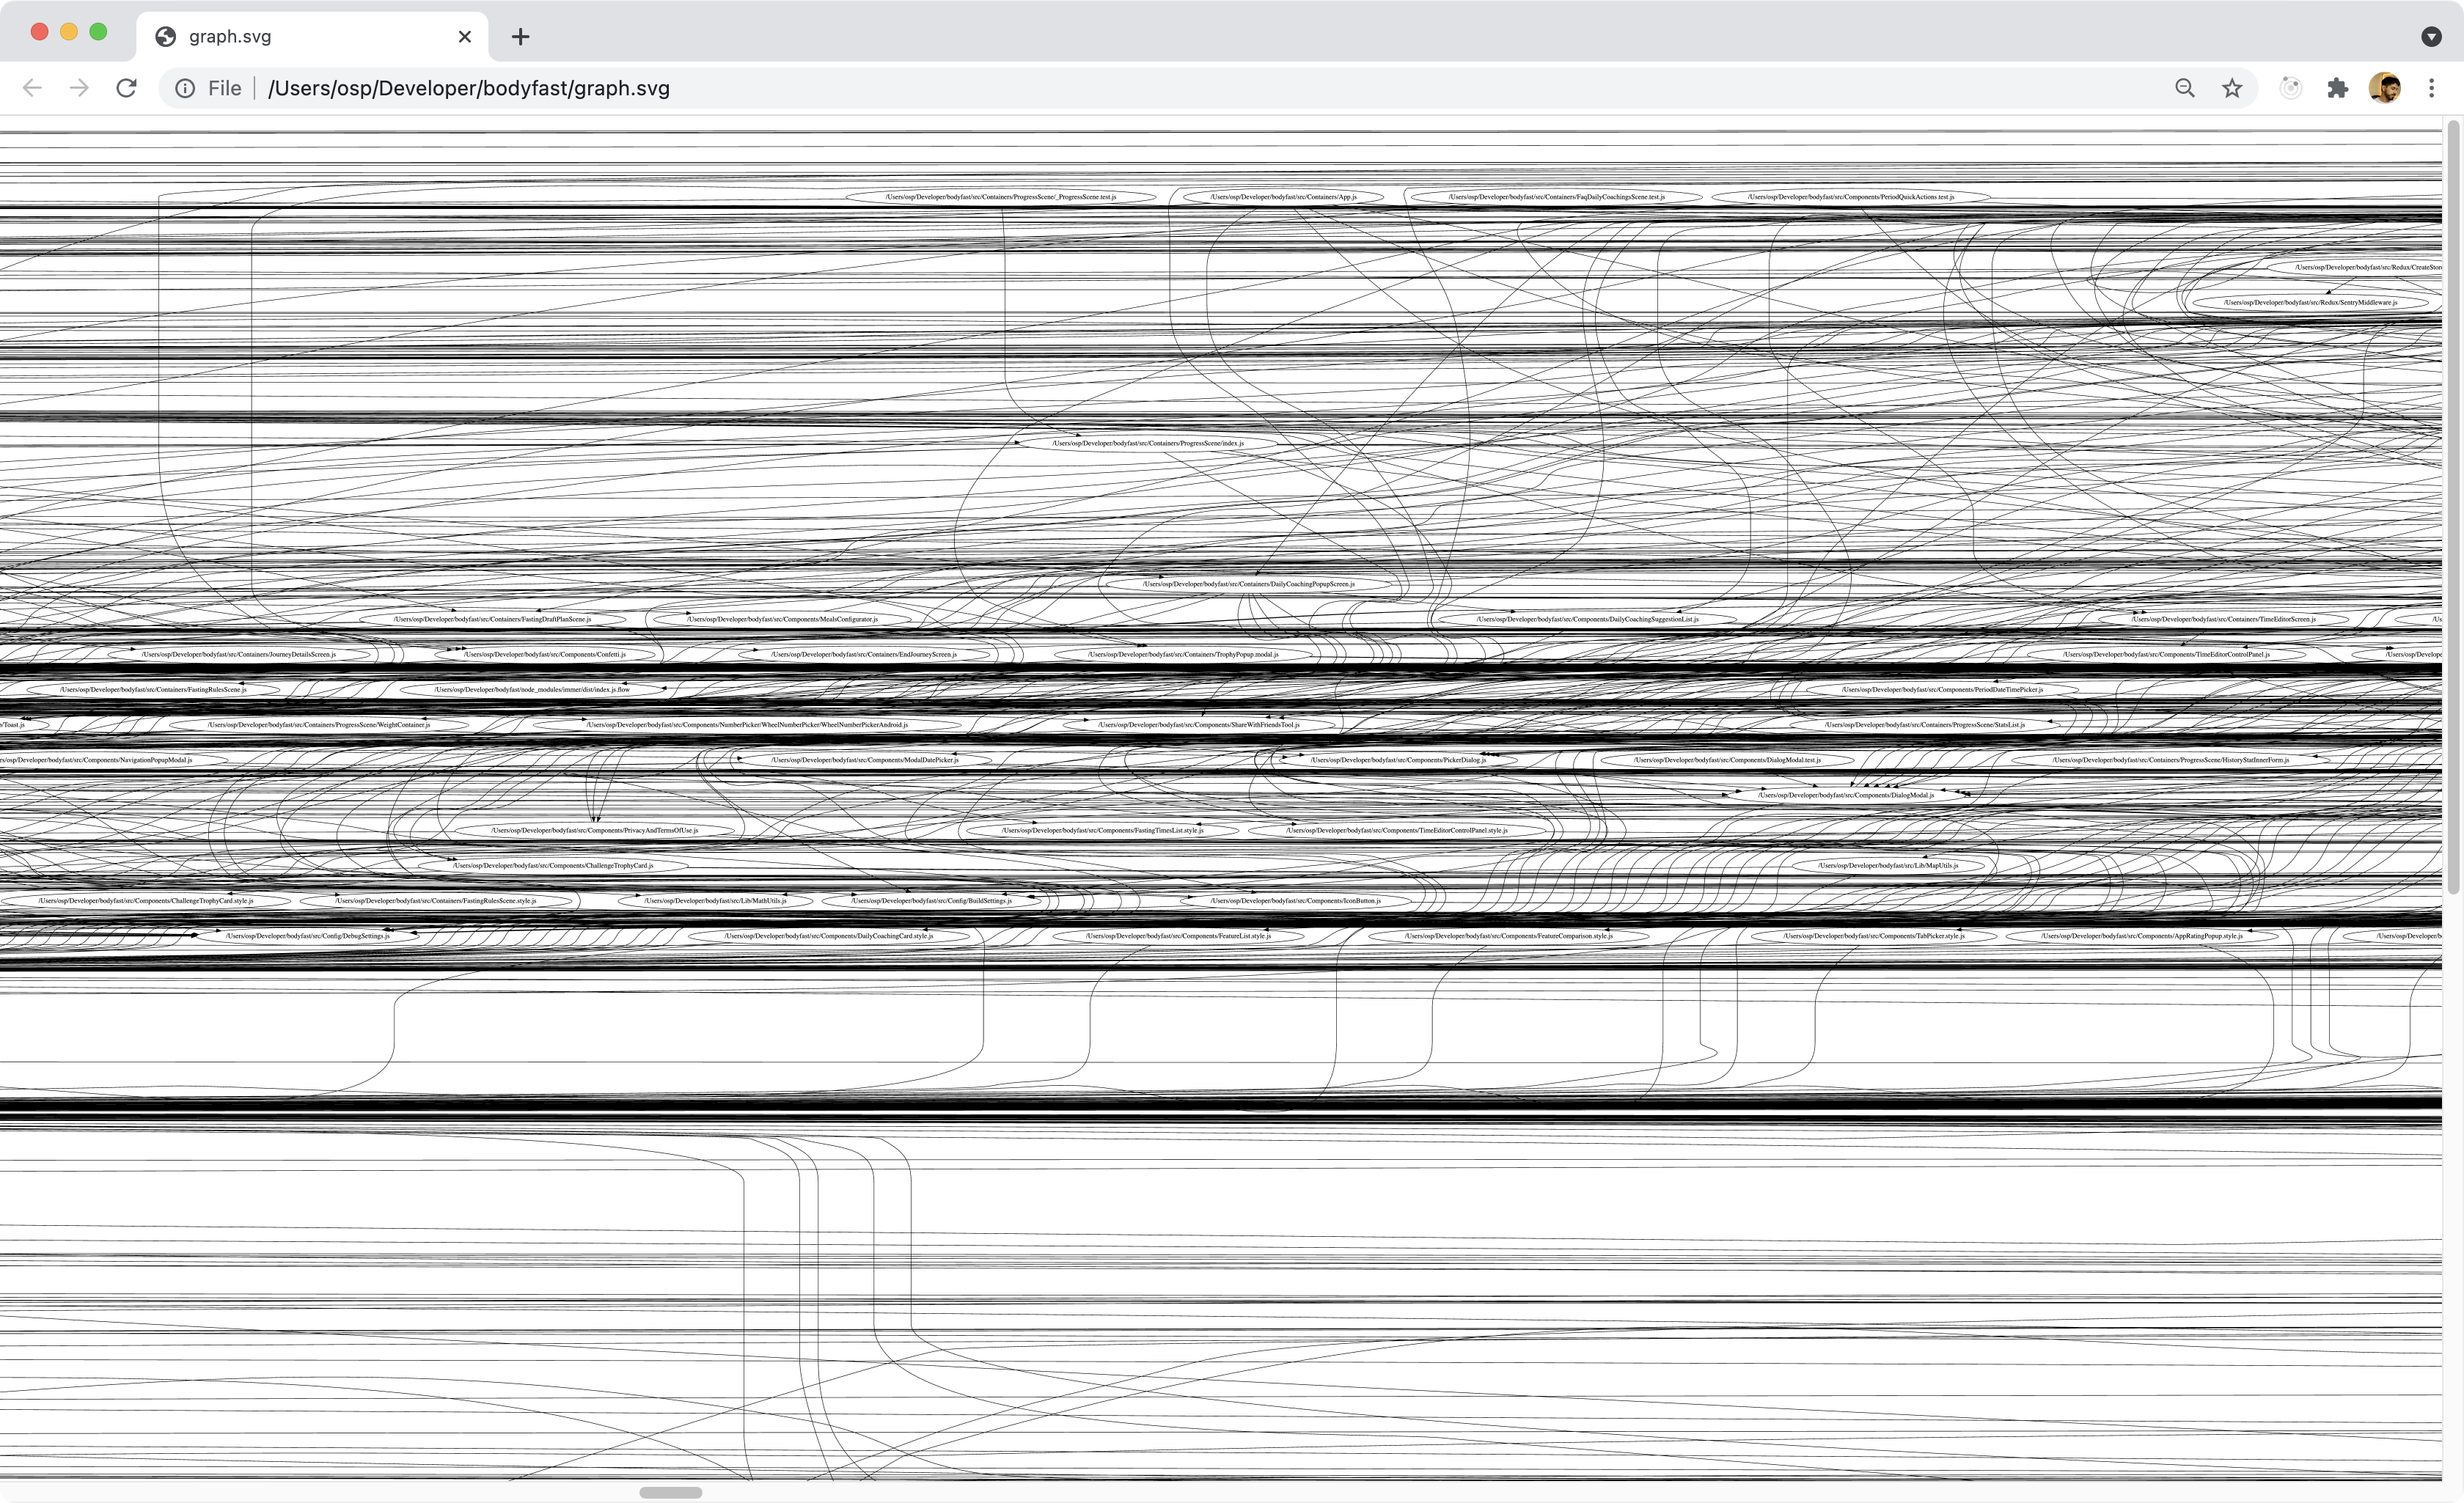
This produces an svg so massive and so filled with squigly lines it is effectively useless… so I had to narrow down the output to just an entry file which I’m interested. Unfortunately the graph command does not take an entry point to generate the graph, so I had to manually narrow down the graph that I had. Here is the gist with the script I ended up coming up with:
Note: I removed the first and last line of the graph file before passing it to the script
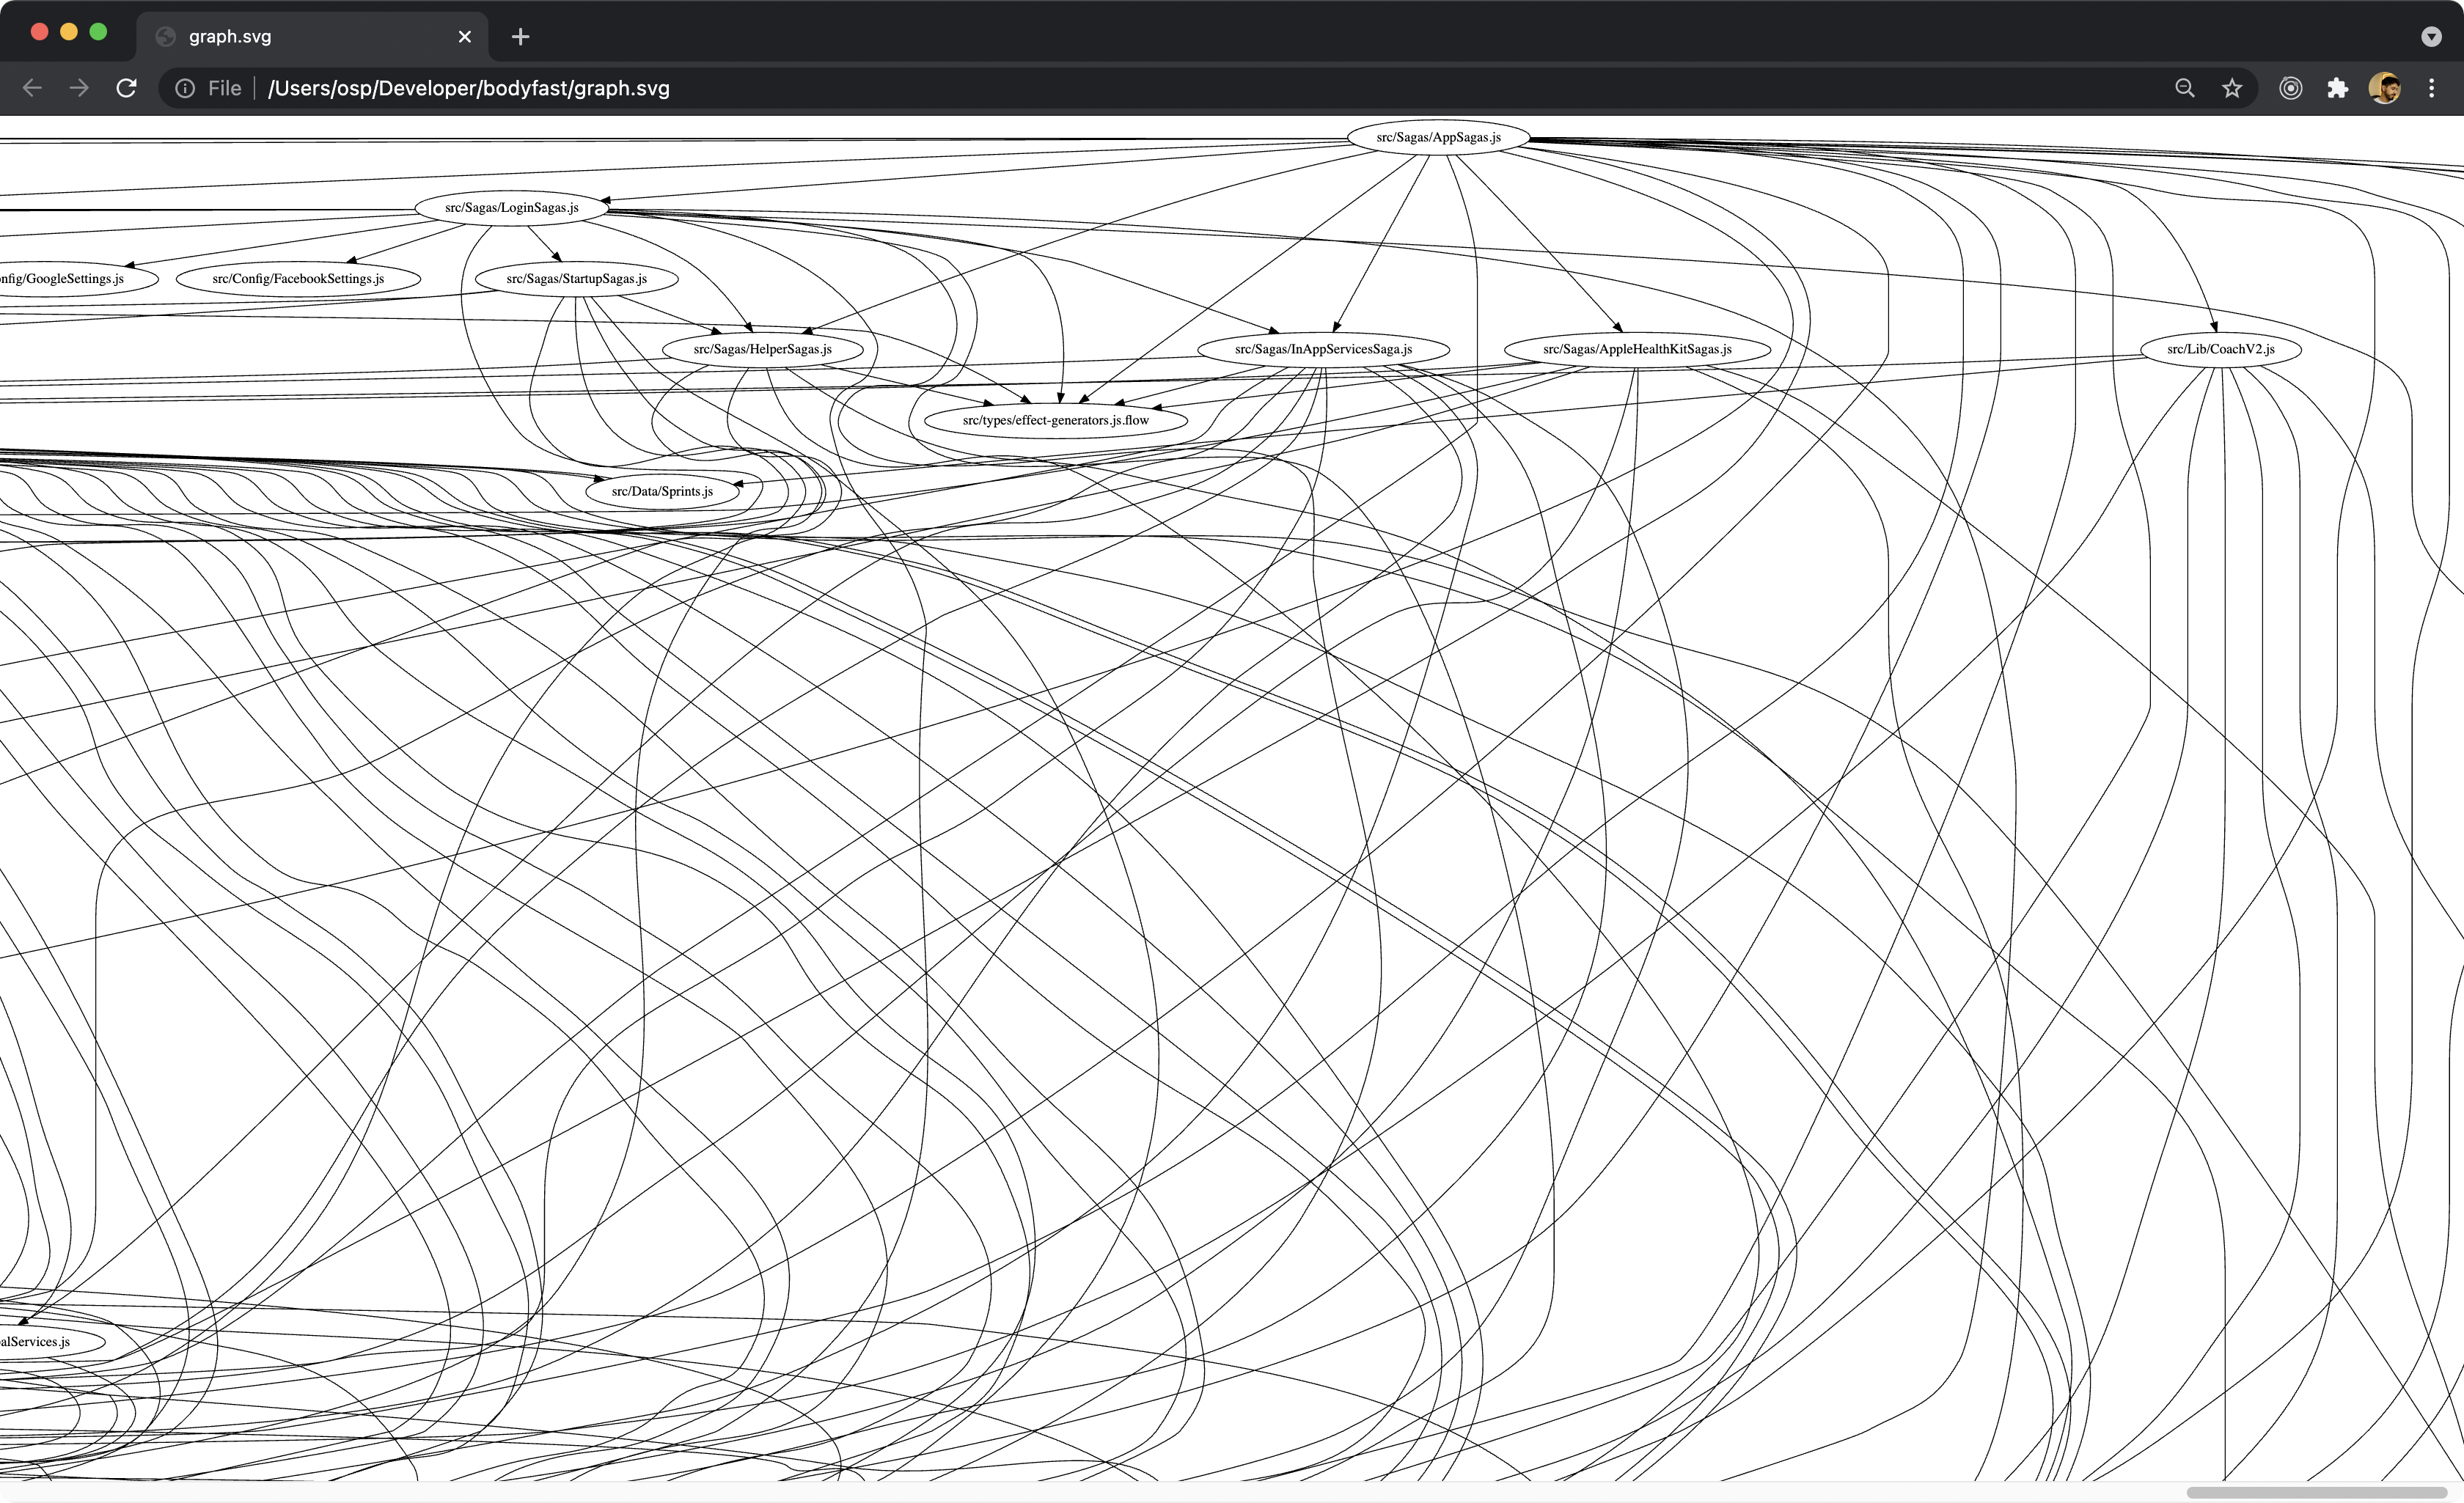
This allowed me to crawl through the entries and finally specify an entry point to the sub-tree that interested me. Once narrowed down, I could finally produce another visualization, and the result is:

Terrible! But not all is useless, I can see the direct imports from the file are correct… and I can indeed see things spiral out of control, importing certain files ends up pulling the entire application code!

The count of objects in this sub-graph also seems to match closely the output produced by flow, this sub-graph has 415 nodes and the editor triggers a 420 file re-check.
Well… it seems to me Flow is doing nothing wrong, it indeed produces the correct dependency graph, but rather that our import structure has grown unchecked so large over the years that we have some architectural mistakes we cannot escape.
My current analysis is that Redux and Sagas are mostly to blame, the boiler plate nature of it and the coupling of action creators, action definitions and the reducers into single files ends up creating this web of dependencies.
Some very abstract suggestions for those along this path: